

By Ankush Bhandari
On April 15th 2025, President Donald J. Trump with stoke of pen “Ensures National Security and Economic Resilience through Section 232 Actions on Processed Critical Minerals and Derivative Products”.
President signed Executive Order which is build on previous actions taken by the Trump Administration to ensure U.S. trade policy serves the nation’s long-term interests.
- On Day One, President Trump initiated his America First Trade Policy to make America’s economy great again.
- On April 2nd 2025, “Liberation Day”, President Trump imposed a 10% tariff on all countries and individualized reciprocal higher tariffs on nations with which the U.S. has the largest trade deficits in order to level the playing field and protect America’s national security.
- More than 75 countries have already reached out to discuss new trade deals.
- As a result, the individualized higher tariffs are currently paused amid these discussions, except for China, which retaliated.
- China faces up to a 245% tariff on imports to the United States as a result of its retaliatory actions.
- This includes a 125% reciprocal tariff, a 20% tariff to address the fentanyl crisis, and Section 301 tariffs on specific goods, between 7.5% and 100%.
- President Trump signed proclamations to close existing loopholes and exemptions to restore a true 25% tariff on steel and elevate the tariff to 25% on aluminum.
- President Trump unveiled the “Fair and Reciprocal Plan” on trade to restore fairness in U.S. trade relationships and counter non-reciprocal trade agreements.
- President Trump signed a memorandum to safeguard American innovation, including the consideration of tariffs to combat digital service taxes (DSTs), fines, practices, and policies that foreign governments levy on American companies.
- President Trump signed similar Executive Orders launching investigations into how imports of copper and imports of timber, lumber, and their derivative products threaten America’s national security and economic stability[1].
Key Insights into US Tariffs
The April 2 escalation builds on previously imposed tariffs projected to generate $1.1 trillion in revenue over the next decade.
However, tariffs on China are expected to yield little revenue due to the high 145% rates, which will significantly lower imports.
Imposed and threatened retaliatory measures are projected to lower US GDP by an additional 0.2% and decrease 10-year revenue by $132 billion. In 2025, Trump’s tariffs could increase federal tax revenues by $166.6 billion, representing 0.55% of GDP, the largest tax hike since 1993.
Tariffs were imposed on approximately $380 billion worth of products from 2018 to 2019, affecting around $1.3 trillion of imports from various trading partners excluding Canada and Mexico.
Fentanyl tariffs target imports from China and non-USMCA sources. Additionally, product-specific tariffs cover $518 billion in steel, aluminum, and autos.
The weighted average applied tariff rate will rise to 25.8%, while the average effective rate will reach 11.3%, the highest since 1943. It is estimated that tariffs will reduce imports by nearly $800 billion, or 23%, by 2025.
Overall, Trump’s tariffs may generate $2.1 trillion in revenue over ten years and reduce US GDP by 0.8%, rising to 1.0% when accounting for foreign retaliation as of April 10. These tariffs are anticipated to decrease after-tax income by 1.2%, resulting in an average tax increase of $1,243 per US household by 2025.
In all, it is estimated that more than $2.3 trillion, or 71 %, of US imports face new tariffs.

What are the major industries Trump Administration has targeted?
- Semiconductors and Pharmaceuticals: President Trump said on January 27,
2025, he would announce new tariffs on computer chips, semiconductors, and pharmaceuticals. On February 18 he announced the rates on semiconductors and pharmaceuticals would be “25 percent and higher.” The authority to impose these tariffs has not been specified.
- Steel and Aluminum: President Trump signed two proclamations on
February 10, 2025, to expand the existing Section 232 tariffs on steel and aluminum. The orders end all existing exemptions for the tariffs, expand the list of derivative articles, and raise the tariff rate on aluminum from 10 percent to 25 percent. The changes took effect March 12, 2025.
- Autos: President Trump announced on February 14, 2025, that he plans to
impose tariffs on auto imports beginning on April 2, 2025. He said on February 18 the rate on autos would be “in the neighborhood of 25 %” while the rates on semiconductors and pharmaceuticals would be “25 % and higher.” On March 26, 2025, Trump signed a proclamation authorizing 25 % tariffs on autos and certain auto parts under Section 232 to take effect April 3 for autos and before May 3 for auto parts. US-based content of certain imports from Canada and Mexico will be exempt.
- Copper: President Trump directed the Commerce Department on February
25, 2025, to begin a Section 232 national security investigation for copper imports; the findings of the report are due by November 22, 2025.
- Lumber: President Trump directed the Commerce Department on March 1,
2025, to begin a Section 232 national security investigation into timber, lumber, and derivative imports; the findings of the report are due by November 26, 2025.
- Agricultural Products: President Trump posted on March 3, 2025, that
Tariffs on “external” agricultural products would begin April 2, 2025.
Trump Administration’s Tariff Policies
Below table provides insights into Trump Tariff Policies

Now, there’s lots of speculation why President Trump has imposed high tariffs on Asian, Pacific Countries which are US allies from decades. Let’s dissect it.
What prompted President Trump to go with Reciprocity on East Asian Countries?
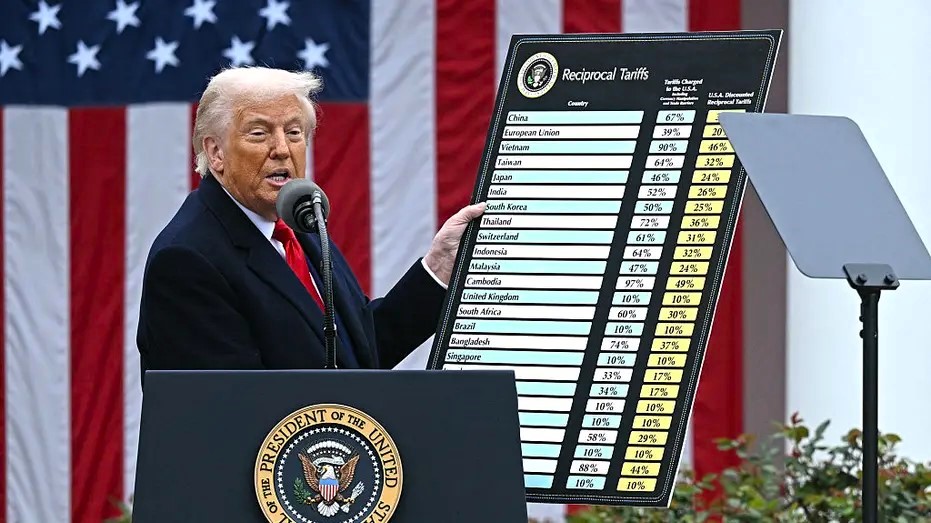
On April 2, President Donald Trump boldly unveiled a series of drastic “reciprocal” tariffs targeting the United States’ key Asian trading partners, including Japan, South Korea, Vietnam, and notably, even Australia and not to mention China.
Vietnam was slammed with an astonishing 46% tariff, while Cambodia was burdened with a staggering 49%.

Average tariff rates in 2024 and tariff rates announced in April 2025 (Source: CFR Research)
Following a sharp decline in bond markets, Trump temporarily stalled many of these tariffs, but primarily focused on China, leading to an aggressive tariff war where both nations imposed tariffs exceeding 100 % on each other’s goods.
Despite the temporary pause, Trump has not minimized the impact of his policies. He has retained a nearly universal 10 % tariff on imports, resulting in the highest average U.S. tariff rate since 1901, when tariff battles grew and later contributed to the Great Depression.
As a consequence, U.S. consumers are now grappling with approximately 28% tariffs on imports overall, a stark contrast to the mere 2% average during President Joe Biden’s administration.
The White House asserts that the newly imposed tariffs will forge a formidable alliance among nations to diminish trade with China, ultimately securing more favorable trade conditions for the U.S. and its allies. However, there is a substantial risk that these tariffs will foster skepticism among Asian nations regarding Washington’s reliability as a partner.
One group of pundits argued that the “reciprocal” nature of these tariffs appears economically illogical, and many Asian countries are less accustomed to the volatility and unpredictability exhibited by Trump compared to their European counterparts.
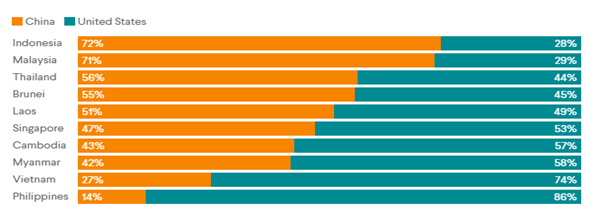
A bar chart of survey responses showing that many Southeast Asian opinion leaders think ASEAN should align with China over the U.S. if forced to choose (Source: CFR Research)
In direct response to Trump’s tariff announcements, Chinese President Xi Jinping is actively strengthening ties in Southeast Asia, as evidenced by his recent visits to Cambodia, Malaysia, and Vietnam, where he signed multiple economic cooperation agreements.
Meanwhile, President Trump is contemplating additional tariffs on imported medicines, following a series of tariffs aimed at both historical adversaries and close allies. Regardless of their established connections with the United States, some regional experts fears that the erratic nature of these actions could significantly erode Asia’s economic confidence in Washington.
Experts also mentioned that this growing uncertainty poses a considerable threat to U.S. defense relationships in the region, potentially undermining American hard power and destabilizing strategic interests in Asia.
However, many Southeast Asian Opinion Leaders Think ASEAN Should Align with China rather than USA but it still remained debatable.
One may wonder why many Asian economies are particularly exposed to higher tariff rates.
Let’s try to drill down…
Beginning in the 1950s and 1960s, many East Asian countries adopted export-oriented industrialization, relying heavily on foreign markets, particularly the United States, to sell their products.
Nations like China and Japan also benefited from large domestic markets, but they remained significant exporters to the U.S. until recently, as they sought to diversify. This strategy significantly boosted the GDP of countries like South Korea and Vietnam.
However, despite their increased wealth and trade agreements, many still depend on exports to the U.S.A., as shown in the below graph.
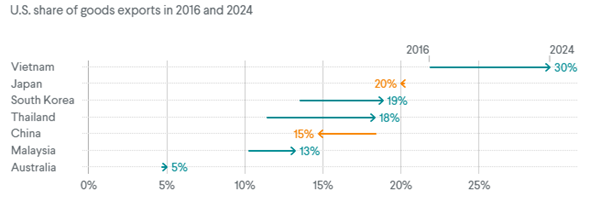
Some Asia-Pacific Countries Have Recently Become More Dependent on U.S. Export Markets (Source: CFR Research)
Recent Trump’s White House policies threaten a decade of bipartisan efforts that encouraged U.S. companies to shift from China to countries like Malaysia and Vietnam.
Concerns have been raised that reshoring often masks continued Chinese exports since countries like Vietnam assemble products using Chinese components to avoid tariffs.

Share of procurement for U.S. and EU-based buyers (Source: CFR Research)
Above graph clearly shows that U.S. and EU Companies have increasingly sourced production in Southeast Asia
It is also worthwhile to mention here that Trump’s trade perspective, influenced by the 1980s when Japan surpassed the U.S. in per capita income, reflects a belief that the U.S. is being taken advantage of by its trade partners. His advocacy for tariffs and a skeptical view of trade relationships continues to shape his policy, particularly towards Asia.
Are these Asia-Pacific countries in calm or in Panic mode?
Asia’s poorest countries and those with significant trade imbalances are trying to meet Trump’s demands to ease proposed tariffs.
For instance, Cambodia, reliant on exports, is working to buy more American goods to reduce tariffs. Vietnam, which has a substantial U.S. trade surplus, has agreed to buy more American-made products and signed a new trade deal with Washington.
However, larger economies like Japan have more leverage. Japan’s trade negotiator recently visited Washington to discuss tariff removal; although no deal was reached, Japan subtly reminded the U.S. of its substantial holdings of U.S. debt. The decline in the U.S. bond market, due to foreign investors selling U.S. bonds, contributed to Trump pausing the tariffs.
Geopolitical experts mentioned that in countries like Australia and South Korea voters are likely to shift to left-leaning parties, which may lead to stronger ties with China and the EU.
Also, smaller economies like Malaysia and Thailand are also likely to strengthen their economic links with China.
The Trump administration frequently announces new tariffs, leaving many trading partners questioning the U.S. as a reliable investment haven. As of now, it remains highly unclear if this negative sentiment can be reversed.
Overall, larger Asian economies are unsettled by the uncertainty of U.S. trade policies.
But it is very evident that China, but not the United States, is part of the Regional Comprehensive Economic Partnership (RCEP), the largest trading bloc in the world.

Source: CFR Research
But, the question which still remains unanswered after reciprocal Tariffs:-
“If ASEAN were forced to align itself with one of the strategic rivals, which trading partner should it choose?” USA or CHINA???
Let’s now unpack US-China Trade war.
Below is the timeline of US-China Tariff War (Source: PIIE)
| 2018 | ||
| 7-Feb | US Section 201 tariffs imposed on solar panels and washing machines | |
| 23-Mar | US Section 232 tariffs imposed on steel and aluminum, temporarily exempting Argentina, Australia, Brazil, EU, Canada, Mexico, and South Korea | |
| 2-Apr | China’s retaliation to US Section 232 tariffs | |
| 1-May | China’s MFN tariff cut on pharmaceuticals | |
| 1-Jun | US end Section 232 steel and aluminum tariff exemptions for EU, Canada, and Mexico. (Argentina, Brazil, and South Korea had earlier agreed to quotas) | |
| 1-Jul | China’s MFN tariff cut on consumer goods, autos, and ITA products | |
| 6-Jul | US Section 301 tariffs of 25% ($34 billion, List 1) imposed and China’s retaliation ($34 billion) | |
| 13-Aug | US Section 232 tariff increase from 25% to 50% on imports of steel from Turkey | |
| 23-Aug | US Section 301 tariffs of 25% ($16 billion, List 2) imposed and China’s retaliation ($16 billion) | |
| 24-Sep | US Section 301 tariffs of 10% ($200 billion, List 3) imposed and China’s retaliation ($60 billion) | |
| 1-Nov | China’s MFN tariff cut on industrial goods | |
| 2019 | ||
| 1-Jan | China suspends retaliation against US autos and parts (Section 301) and reduces MFN tariff rates for 2019 | |
| 7-Feb | US Section 201 tariffs reduced on solar panels and washing machines in second year of policy | |
| 20-May | US exempts Canada and Mexico from Section 232 tariffs on steel and aluminum in exchange for both agreeing to VERs | |
| 21-May | US reduces Section 232 tariff on steel imports from Turkey from 50% to 25% | |
| June | US Section 301 tariffs (10% to 25% increase on List 3, effective June 15) imposed and China’s retaliation on some US products (subset of $60 billion, effective June 1) | |
| 1-Jul | China’s MFN tariff cut on ITA products | |
| 1-Sep | US Section 301 tariffs of 15% (subset of $300 billion, List 4A) imposed and China’s retaliation on some US products (subset of $75 billion) | |
| 18-Oct | US imposes Section 301 tariffs on selected imports from EU after WTO authorization in Airbus dispute | |
| 2020 | ||
| 1-Jan | China adjusts MFN tariff rates for 2020, and US reduces tariffs on imports from Japan under US-Japan Trade Agreement | |
| 7-Feb | US Section 201 tariffs reduced on solar panels and washing machines in third year of policy | |
| 8-Feb | US Section 232 import tariffs extended to products that use aluminum and steel | |
| 14-Feb | US Section 301 tariffs of 15% imposed on September 1, 2019 (List 4A) cut to 7.5%, and China’s retaliatory tariffs imposed on September 1, 2019 cut in half | |
| 5-Mar | US adjusts Section 301 tariffs on selected imports from EU related to Airbus dispute | |
| 1-Jul | China’s MFN tariffs cut on ITA products | |
| 16-Aug | US reimposes Section 232 tariff of 10% on certain aluminum products from Canada | |
| 1-Sep | US eliminates re-imposed Section 232 tariff of 10% on certain aluminum products from Canada | |
| 2021 | ||
| 1-Jan | China adjusts MFN tariff rates for 2021, and US reduces tariffs on imports from Japan under US-Japan Trade Agreement | |
| 14-Jan | US adjusts Section 301 tariffs on selected imports from EU related to Airbus dispute | |
| Jan20* | Biden administration starts, Trump administration ends | |
| 7-Feb | US Section 201 tariffs reduced on solar panels and washing machines in fourth year of policy (washing machines had received an extension) | |
| March | US suspends Section 301 tariffs on selected imports from EU (March 11) and UK (March 4) related to Airbus dispute | |
| 1-May | China’s MFN tariffs cut on some steel products | |
| 1-Jul | China’s MFN tariffs cut on ITA products | |
| 2022 | ||
| 1-Jan | China adjusts MFN tariff rates for 2022; US Section 232 tariffs on imports of steel and aluminum from the EU converted to a tariff-rate quota | |
| 7-Feb | US Section 201 tariffs reduced on solar panels and washing machines in fifth year of policy (solar panels had received an extension) | |
| 11-Apr | US Section 232 tariffs on imports of steel from Japan converted to a tariff-rate quota | |
| 1-May | China’s MFN tariffs cut to zero on coal | |
| 1-Jun | US Section 232 tariffs on imports of steel and aluminum from the UK converted to a tariff-rate quota | |
| 1-Jul | China’s MFN tariffs cut on ITA products | |
| 2023 | ||
| 1-Jan | China’s MFN tariffs cut on selected products, effective MFN tariff increased on frozen chicken under conversion from special to ad valorem rate | |
| 7-Feb | US Section 201 tariffs reduced on solar panels in sixth year of policy; Section 201 tariffs on washing machines expire | |
| 1-Jul | China’s MFN tariff cut on ITA products | |
| 31-Dec | China’s MFN tariffs on coal revert back to higher, binding rate | |
| 2024 | ||
| 1-Jan | China adjusts MFN tariff rates for 2024 | |
| 26-Jun | US Section 201 tariffs reduced on solar panels in seventh year of policy | |
| 27-Sep | US Section 301 tariffs adjusted on selected Chinese products, including electric vehicles | |
| 2025 | ||
| 1-Jan | China adjusts MFN tariff rates for 2025; US Section 301 tariffs imposed adjusted on selected Chinese products, including tungsten, wafers, and polysilicon | |
| Jan20* | Trump administration starts, Biden administration ends | |
| 4-Feb | US tariffs of 10 % imposed on all imports from China under International Emergency Economic Powers Act (IEEPA) | |
| 7-Feb | US Section 201 tariffs reduced on solar panels in eighth year of policy | |
| 10-Feb | China retaliates against US tariffs under IEEPA imposed February 4 | |
| 4-Mar | US tariffs of 10 % on all imports from China under IEEPA; US tariffs imposed on imports from Canada and Mexico that are not compliant with USMCA [not shown] | |
| 10-Mar | China retaliates against US tariffs under IEEPA imposed March 4 | |
| 12-Mar | US Section 232 tariffs imposed on steel, aluminum, and derivative products | |
| 3-Apr | US Section 232 tariffs of 25 % imposed on automobiles | |
| 5-Apr | US tariffs of 10 % imposed on nearly all countries, including China, under IEEPA, but with some sector carveouts | |
| 9-Apr | US tariffs ranging from 1 % to 74 % imposed on nearly all countries with a trade surplus with the US, including China (74 %), under IEEPA. US tariff on China includes an additional 50 % tariff as counter-retaliation for China’s retaliation announcement | |
| 10-Apr | China retaliates against US tariffs under IEEPA imposed April 5 and 9 by imposing tariffs of 84 %; US eliminates tariffs imposed April 9 on trade surplus countries under IEEPA with exception of China, which faces an additional 41 % tariff increase under IEEPA (to 125 % total), but with some sector carveouts | |
| 11-Apr | US removes some additional tariffs imposed under IEEPA on April 5, 9, and 10, carving out some additional products that contain semiconductors | |
| 12-Apr | China retaliates against US tariffs under IEEPA imposed April 10, to reach levels of recent US tariff increases of 125 % | |
Overall, the US-China trade war has proceeded in six stages between 2018 and today.
- The first six months of 2018 featured a moderate increase in tariffs.
- Second, the months of July through September 2018 resulted in a sharp tariff increase on both sides: US average tariffs rose from 3.8 % to 12.0 percent, and China’s average tariffs increased from 7.2 percent to 18.3 %.
- In stage three, there was an 8-month period (September 25, 2018, through June 2019) of little change in tariffs.
- In Stage Four, from June to September 2019, another set of tariff increases kicked in.
- In stage five, and despite the phase one agreement, tariffs between the two countries remained elevated but mostly stable until February 2025.
- In the current stage six, the US has suddenly increased tariffs again by significant amounts and China has increased its average tariff by even more.

Source: PIIE
Impact of Trump’s Tariff on US Economy
When imposed on a permanent basis, the tariffs would increase tax revenue for the federal government.
Revenue is lower on a dynamic basis, a reflection of the negative effect tariffs have on US economic output, reducing incomes and resulting tax revenues.
Revenue would fall more when factoring in foreign retaliation, as retaliation would cause US output and incomes to shrink further.
| GDP | Capital Stock | Pre-Tax Wages | Hours Worked Converted to Full-Time Equivalent Jobs | |
| Total Imposed US Tariffs | -0.80% | -0.60% | 0.00% | -664,000 |
| IEEPA Fentanyl/”Reciprocal” China | -0.30% | -0.20% | 0.00% | -260,000 |
| Reciprocal” Mexico | Less than -0.05% | Less than -0.05% | 0.00% | -36,000 |
| Reciprocal” Canada | Less than -0.05% | Less than -0.05% | 0.00% | -24,000 |
| Reciprocal EU | -0.10% | -0.10% | 0.00% | -66,000 |
| Reciprocal ROW | -0.20% | -0.20% | 0.00% | -160,000 |
| Sec 232 Steel Aluminum | Less than -0.05% | Less than -0.05% | 0.00% | -22,000 |
| Sec 232 Auto | -0.10% | -0.10% | 0.00% | -96,000 |
| Imposed and Threatened Retaliation as of April 4 | -0.20% | -0.10% | 0.00% | -141,000 |
Estimated Impact of Tariff on US Economy (Source TaxFoundation)
On a conventional basis, before incorporating the negative effects of tariffs on the US economy, all the tariffs together would increase US federal tax revenue by $2.1 trillion over the next decade.
The April 2 “reciprocal” tariffs on the EU and countries excluding Canada, Mexico, and China increase tax revenue by $1.0 trillion, assuming the 90-day pause ends as scheduled.
Notably, the tariffs on China, which for most imports are levied at 145 percent, raise comparatively small amounts of revenue as we estimate very few imports would continue under such high tariff rates.
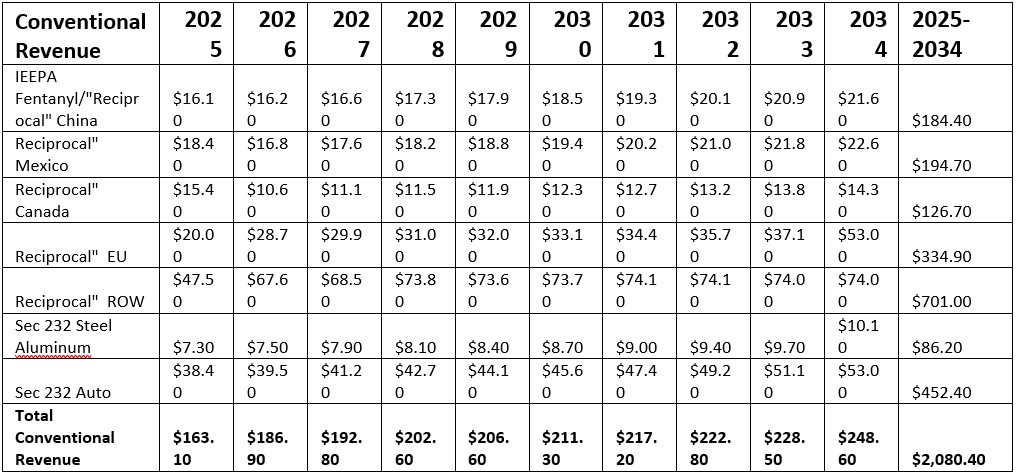
Conventional Revenue(Source TaxFoundation)
On a dynamic basis, incorporating the negative effects of the US-imposed tariffs on the US economy, all the tariffs together would raise $1.5 trillion over the next decade, about $600 billion less than the conventional estimate.
Incorporating the negative effects of imposed and threatened retaliatory tariffs as of April 9, 2025, further reduces 10-year revenue by $132 billion.
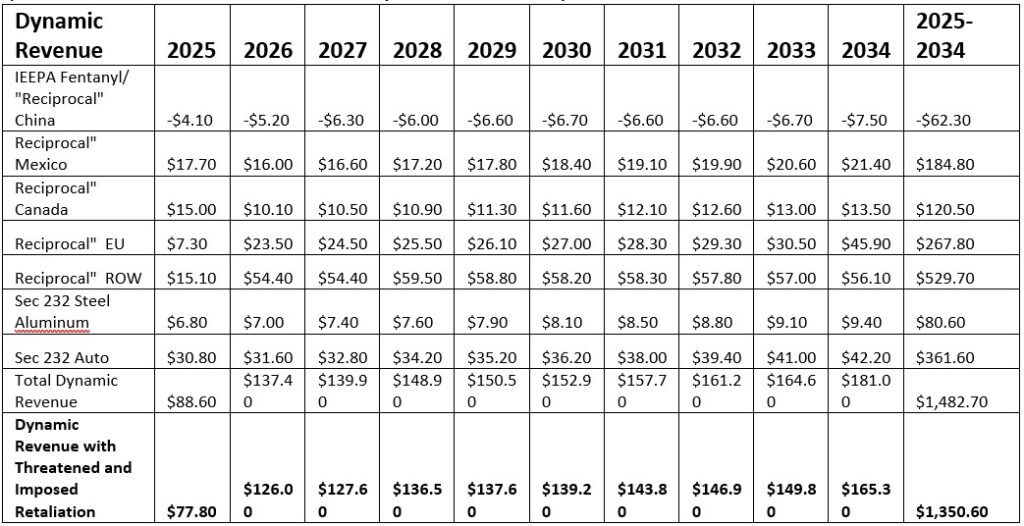
Dynamic Revenue (Source TaxFoundation)
Trump’s Tariffs effect on Applied and Effective Tariff Rates
The new tariffs will significantly raise the tariff rates the US applies to most imports. According to the World Bank, the weighted average applied tariff was 1.5 percent in 2022. It is estimated that under the tariffs currently imposed, it rises by 24.3 percentage points, reaching 25.8 percent.
The weighted average applied tariff rate measures the rate imposed on different products from different countries, and it differs from averages measured by actual tariff revenues as a share of total goods imports.

Applied Tariff Rates
The average effective tariff rate is estimated as a share of total goods imports will change. On a static basis, without taking into account any behavioral changes, such as a decrease in imports, it’s estimated that the average effective tariff rate would rise to 18.0 percent.
After incorporating behavioral responses, including estimated drop in imports of nearly $800 billion (23 percent), estimate the average effective tariff rate will rise to 11.3 percent—the highest rate since 1943.

Effective Tariff Rates
In 2025, Trump’s tariffs will increase federal tax revenues by $163 billion, or 0.54 % of GDP, making the tariffs the largest tax hike since 1993. The tariffs are larger than the tax increases enacted under Presidents George H.W. Bush and Barack Obama.

Trump’s Average Tariff Rate Would Be Highest Since 1943
Conclusion
Economists broadly concur that free trade significantly boosts economic output and income, while trade barriers impose serious constraints on these vital elements.
Historical evidence consistently reveals that tariffs drive up prices and limit the availability of goods and services for American businesses and consumers.
The consequences are clear: lower incomes, reduced employment opportunities, and diminished economic growth.
Tariffs can adversely affect U.S. output through several critical channels. One prominent mechanism is the transference of tariff costs to producers and consumers, leading to higher prices. As the costs of parts and materials soar, the prices of finished goods follow suit, ultimately constraining private sector output. This not only results in lower earnings for labor and capital owners but also diminishes the after-tax value of income for consumers.
As prices rise and returns on labor and capital shrink, the incentive for Americans to work and invest diminishes, causing a downward spiral in economic output.
Furthermore, tariffs may trigger an appreciation of the U.S. dollar, potentially offsetting price increases for American consumers.
However, a stronger dollar complicates life for exporters, making it harder for them to compete in the global market and generating lower revenues. This scenario inevitably contributes to decreased U.S. output and reduced incomes for both workers and capital owners, further discouraging work and investment and leading to a contraction of the economy.
Numerous economists have meticulously analyzed the ramifications of trade war tariffs on the American economy, and the findings are compelling: these tariffs have not only raised prices but have also significantly lowered economic output and employment since the trade war commenced in 2018.
Economic Pundits across the globe believe that the evidence is unmistakable; the negative impact of such protective measures on the economy is profound and far-reaching.
However, President Donald Trump mentioned that companies like Apple, Eli Lilly, and Stargate, as well as countries such as Saudi Arabia, the United Arab Emirates, and Japan, have already initiated investments of over $7 trillion as private investment.
Time is a great essence here and will only tell if 2025 will witness an “Economic Nuclear Winter or Not”.
[1] Fact Sheet: President Donald J. Trump Ensures National Security and Economic Resilience Through Section 232 Actions on Processed Critical Minerals and Derivative Products – The White House